Implementing TA-Lib and Matching Candlestick Patterns with Python
Animesh Pandey
Senior Software Engineer with 7+ years of experience in PHP, Python, and full-stack development.
TA-Lib candlestick pattern detection in Python
Candlestick patterns are one input among many in technical analysis—not buy/sell signals on their own. I've used TA-Lib to screen historical OHLC data for pattern occurrences before layering on volume, trend context, and risk rules.
This post walks through installation, loading real market data, detecting patterns, and understanding what the output actually means.
Disclaimer: This is educational content, not financial advice. Past pattern occurrences do not predict future price movements. Always do your own research and consult a qualified financial advisor before trading.
Installation
TA-Lib wraps a C library. Install the native dependency first, then the Python package.
macOS (Homebrew):
brew install ta-lib pip install TA-Lib pandas numpy
Ubuntu/Debian:
sudo apt-get install libta-lib0 libta-lib-dev pip install TA-Lib pandas numpy
Windows: download the prebuilt binary from ta-lib.org and follow their install notes before pip install TA-Lib.
Optional packages for data and charts:
pip install yfinance mplfinance
Load OHLC data with yfinance
Instead of hand-crafted sample rows, pull recent daily candles:
import pandas as pd import yfinance as yf ticker = yf.Ticker("AAPL") df = ticker.history(period="6mo", interval="1d") df = df.reset_index() # TA-Lib expects float arrays df = df.rename(columns={ "Date": "date", "Open": "open", "High": "high", "Low": "low", "Close": "close", }) print(df[["date", "open", "high", "low", "close"]].tail())
For offline testing or CI, a small synthetic dataset works:
df = pd.DataFrame({ "date": pd.to_datetime(["2024-02-20", "2024-02-21", "2024-02-22", "2024-02-23", "2024-02-24"]), "open": [100.0, 102.0, 101.0, 103.0, 105.0], "high": [105.0, 106.0, 104.0, 107.0, 108.0], "low": [98.0, 99.0, 97.0, 100.0, 102.0], "close": [104.0, 101.0, 103.0, 106.0, 107.0], })
Detect patterns
TA-Lib exposes dozens of pattern functions. Group them programmatically:
import talib as ta def get_candlestick_patterns(): return { name: getattr(ta, name) for name in ta.get_function_groups()["Pattern Recognition"] } def detect_patterns(df, patterns): o, h, l, c = df["open"], df["high"], df["low"], df["close"] results = pd.DataFrame(index=df.index) for name, func in patterns.items(): results[name] = func(o, h, l, c) return results patterns = get_candlestick_patterns() pattern_df = detect_patterns(df, patterns) # Show only rows where at least one pattern fired hits = pattern_df[(pattern_df != 0).any(axis=1)] print(hits)
Interpreting output
TA-Lib pattern functions return integers per bar:
| Value | Meaning |
| ------ | ------------------------ |
| +100 | Bullish pattern detected |
| -100 | Bearish pattern detected |
| 0 | No pattern on that bar |
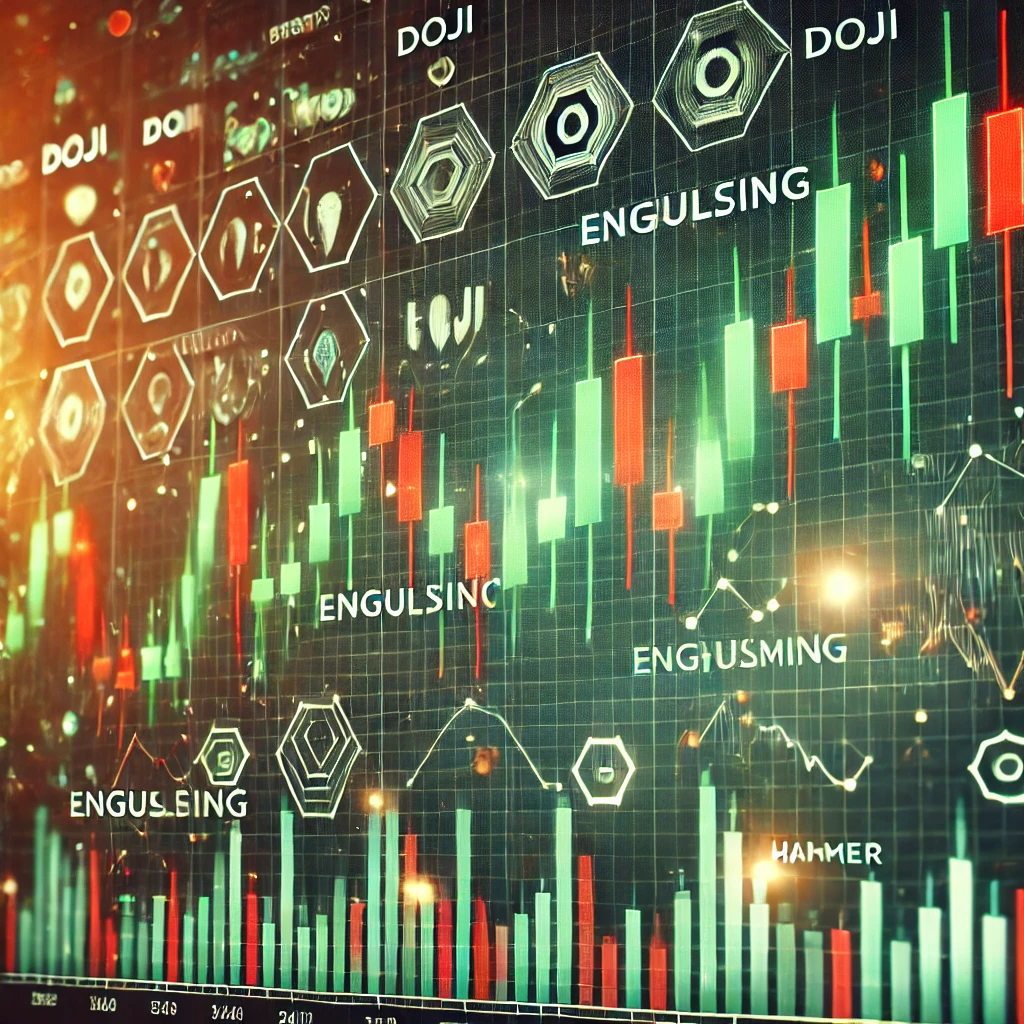
A Doji (CDLDOJI) near 0 across many bars is normal—it indicates indecision, not a guaranteed reversal. Context matters: a hammer at the bottom of a downtrend carries different weight than the same shape mid-range.
Filter to patterns you care about:
key_patterns = ["CDLDOJI", "CDLENGULFING", "CDLHAMMER", "CDLSHOOTINGSTAR"] subset = pattern_df[key_patterns] print(subset[subset.ne(0).any(axis=1)])
Visualize (optional)
import mplfinance as mpf plot_df = df.set_index("date")[["open", "high", "low", "close"]] mpf.plot(plot_df.tail(60), type="candle", style="charles", volume=False)
Overlaying detected patterns on the chart requires mapping non-zero rows to markers—left as an exercise if you build a screening tool.
Limitations
- Lagging indicator: patterns describe completed candles. By the time a pattern prints, price may have already moved.
- No edge by default: academic studies show mixed results for candlestick-only strategies. Combine with trend filters, support/resistance, and position sizing.
- Data quality: splits, dividends, and bad ticks produce false patterns. Clean your OHLC feed.
- Parameter sensitivity: TA-Lib uses fixed definitions. Real traders often adjust lookback windows and confirmation rules.
- Overfitting: scanning 60+ patterns across years of data will surface "signals" by chance. Hold out test data.
Summary
TA-Lib automates pattern scanning over OHLC series—useful for research and rule-based screeners, not as a standalone trading system. Install the C library first, feed it clean data, interpret ±100 outputs with trend context, and treat results as one input in a broader process.